IATA’s June 2025 industry outlook projects total 2025 airline revenues at a record USD 979 billion, yet total expenses at USD 913 billion — leaving an industry-wide net profit margin of just 3.9 percent. Even the small Himalayan country named Nepal, which houses the most dangerous airport in the world – Lukla Airport– aviation contributes more than $1 billion in GDP.
The average net profit per passenger in 2026 is expected to reach just USD 7.90, per IATA’s December 2025 profitability forecast. This is less than the cost of a single checked bag on most U.S. carriers. For comparison, due to the ongoing Iran War, United Airlines (UA) just increased its checked bag fees by $10. Airlines have found increasingly sophisticated ways to monetise every dimension of the passenger journey, transforming what was once a simple seat-for-fare transaction into a multi-layered revenue architecture that IdeaWorksCompany’s 2025 Yearbook of Ancillary Revenue projects will generate USD 157 billion in non-ticket income in 2025 alone. This is a figure that now represents 15.7 percent of total airline revenue, up from 9.1 percent in 2016.
Understanding how airlines make money in 2026 requires abandoning the intuition that the ticket price is the airline’s primary revenue source. Ticket sales, ancillary revenue, and cargo form a bulk of the way airlines really make money but the structure of each has evolved dramatically. The real average return airfare for 2025 is USD 374 in 2025 dollars — 40 percent below 2014 levels, meaning passengers are paying dramatically less for the seat itself while airlines extract dramatically more from the add-ons, partnerships, and financial products that surround it.
.jpg)
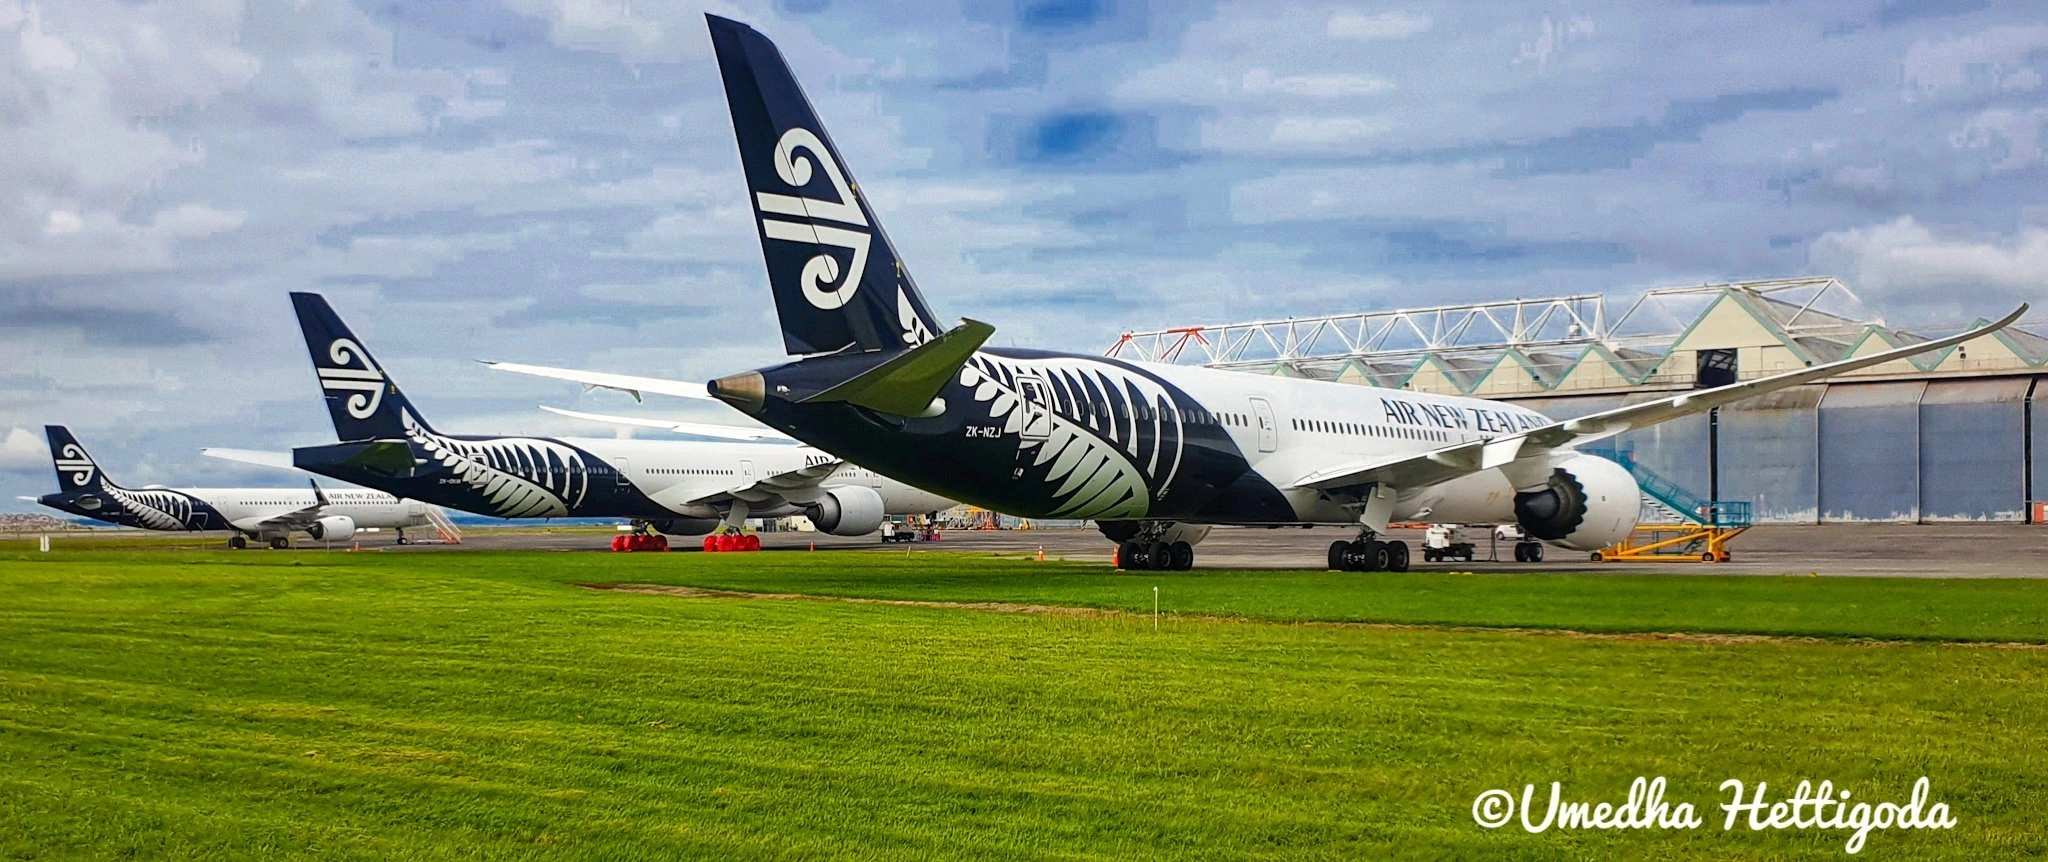
Ticket Revenue and Yield Management In Airline Pricing Strategy
Ticket sales remain the largest single contributor to airline revenue in absolute terms, with IATA projecting passenger revenues of USD 693 billion in 2025 — an all-time high — across a projected 4.99 billion total travellers.
But the economics of how that revenue is extracted have been completely transformed by yield management, basic economy, and algorithmic dynamic pricing into a system that bears almost no resemblance to the regulated, fixed-fare environment of pre-deregulation aviation.
The U.S. Airline Deregulation Act of 1978 removed Civil Aeronautics Board (CAB) price controls and gave airlines the freedom to set their own fares — triggering the gradual development of revenue management systems that now adjust seat prices thousands of times per day per flight, using algorithms that simultaneously model demand curves, competitor pricing, booking pace, load factor, historical patterns, and price elasticity by passenger segment.
The foundational principle is that an empty seat generates zero revenue while a full aircraft at below-optimal yield is nearly as damaging. The IdeaWorksCompany 2025 analysis notes that the introduction of basic economy fares — offering deeply discounted fares stripped of seat selection, changes, and cabin bag allowances — has enabled airlines to serve price-sensitive leisure travellers at the lowest possible yield without sacrificing premium cabin revenue from business travellers in the same cabin.
The consequence is a structurally bifurcated revenue model: premium travellers, who account for 10 to 12 percent of passengers, consistently generate approximately twice the revenue per passenger of economy travelers through a combination of higher fares, onboard purchases, and loyalty programme activity. Load factor — the percentage of available seats filled — directly governs the relationship between these two streams, making the aircraft itself a revenue-maximisation device whose financial performance is measured in revenue passenger kilometres (RPK) per available seat kilometre (ASK), the industry’s standard yield metric.

Ancillary Revenue: USD 157 Billion In 2025 From Bags, Seats, And Services
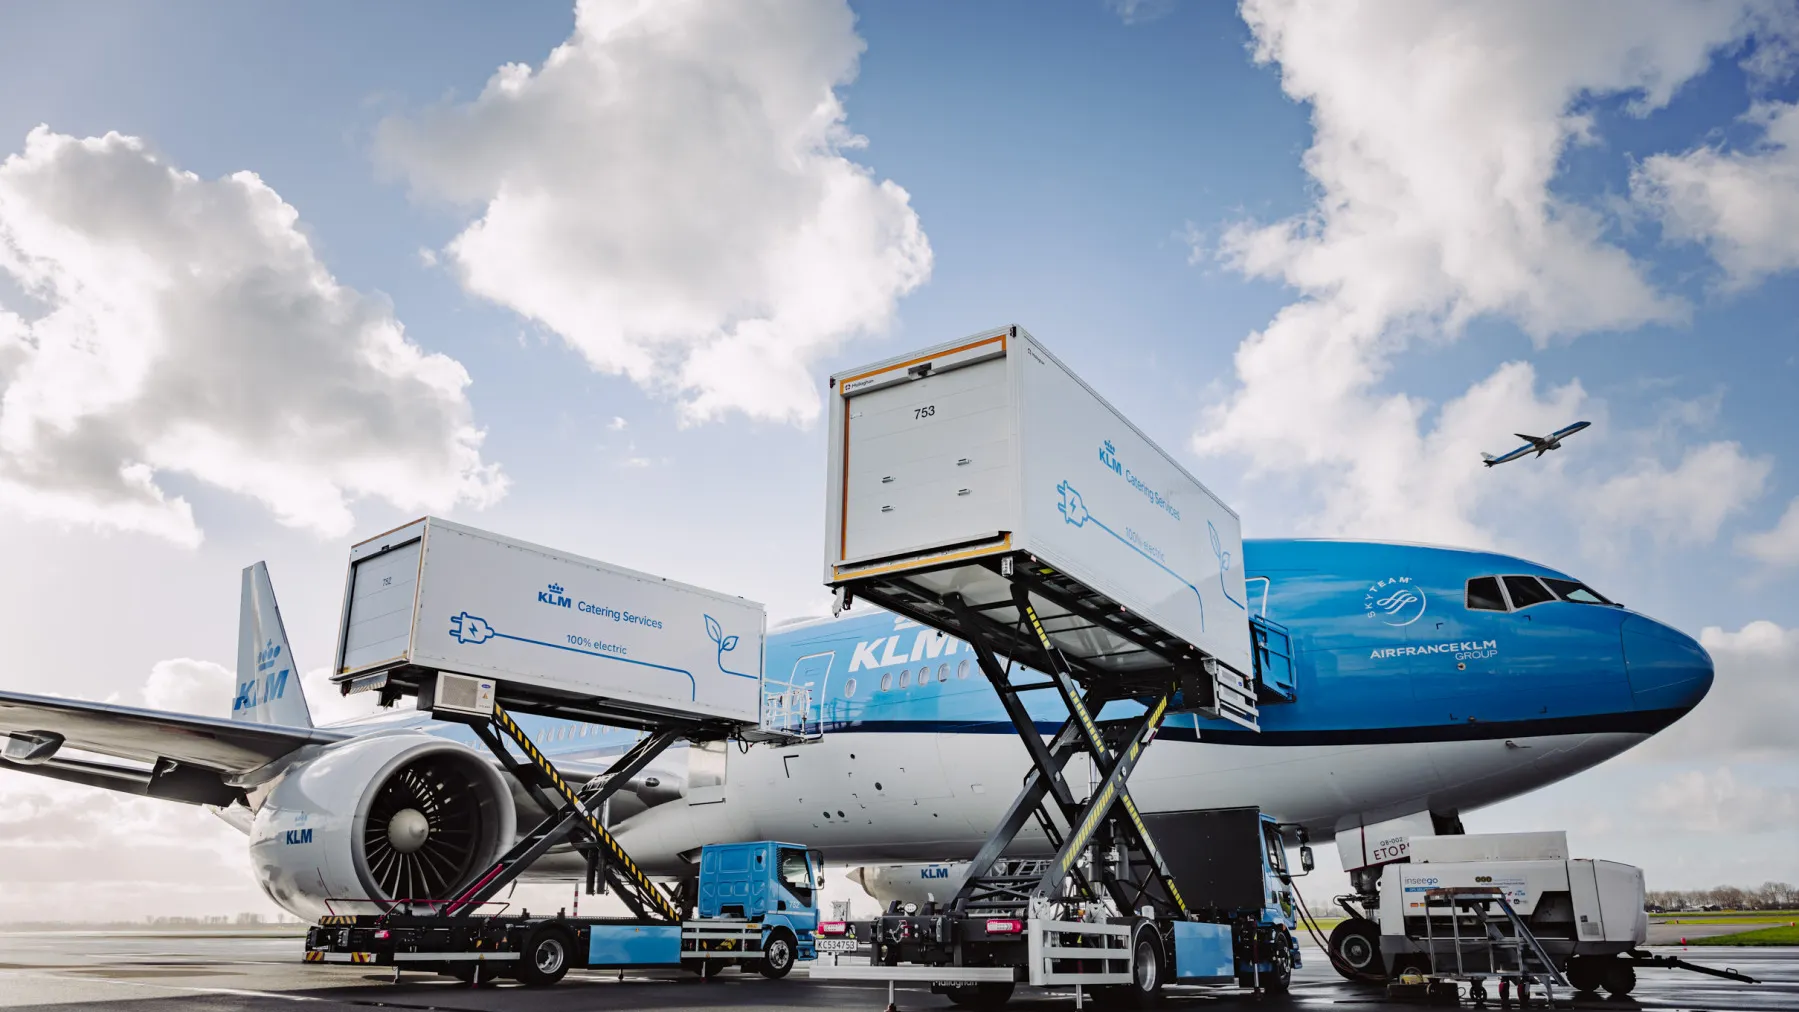
The most structurally consequential transformation in airline economics over the past 18 years is the unbundling of the air travel product and the systematic repricing of components that were once included in the ticket fare. IdeaWorksCompany’s November 2025 projection of USD 157 billion in global ancillary revenue in 2025 — up from USD 148.4 billion in 2024 and USD 109.5 billion in the pre-pandemic record year of 2019 — confirms that ancillary monetisation has survived, and indeed accelerated through, the COVID-19 disruption that grounded most of the global fleet for 18 months.
American Airlines charged the first domestic checked bag fee of USD 25 on May 5, 2008, triggering rapid industry-wide adoption; by 2023, the U.S. Bureau of Transportation Statistics recorded USD 7.0 billion in domestic baggage fee revenue alone across 18 carriers. Globally, baggage fees delivered an estimated USD 33.3 billion in 2025 — 4.1 percent of total global airline revenue — making excess baggage one of the most reliable profit streams in the entire industry.
Seat selection and legroom upgrades have emerged as a parallel ancillary revenue driver with even higher margin characteristics. Unlike baggage fees, which involve handling costs, allocated seating fees require minimal incremental operational expenditure — the seat exists, the aircraft flies regardless, and the fee is pure revenue above variable cost.
DWU Consulting’s March 2026 structural analysis of airline ancillary economics notes that for ultra-low-cost carriers (ULCCs) including Spirit (before its 2024 bankruptcy), Frontier, and Wizz Air, ancillary revenue as a percentage of total revenue reaches 52 to 62 percent — meaning the seat fare itself is effectively loss-leading, and the business model depends entirely on the passenger purchasing add-ons.
IdeaWorksCompany’s report authors Jay Sorensen noted:
“Joining the top 10 ancillary revenue list requires maximum effort to generate big cashflow from two crucial categories: baggage and assigned seats.”
Airline Loyalty Programs Worth More Than Airlines Themselves
The most financially sophisticated — and least publicly understood — component of modern airline revenue is the loyalty programme ecosystem, which has evolved from a customer retention tool into what On Point Loyalty’s 2026 global ranking describes as “a standalone, high-value business” that in some cases exceeds the market capitalisation of the airline that operates it.
The On Point Loyalty Top 100 Most Valuable Airline Loyalty Programs 2026 report, published March 30, 2026 and based on analysis of more than 170 airlines worldwide incorporating 50 valuation variables, places Delta Air Lines’ (DL) SkyMiles at USD 31.7 billion, American Airlines’ (AA) AAdvantage at USD 26.7 billion, and United Airlines’ (UA) MileagePlus at USD 25.3 billion. All three program valuations exceed the individual equity market capitalizations of most global airlines — a structural inversion that the report characterizes as evidence that loyalty programs have become “core drivers of airline enterprise value“.
The financial mechanics that produce these valuations are counterintuitive. Airlines do not profit from loyalty programs by operating them cheaply — they profit by selling miles to banks and commercial partners at prices that exceed the cost of the flights those miles eventually redeem. Delta’s partnership with American Express delivered USD 7.4 billion in revenue in 2024, with a target of USD 10 billion annually by 2029 — a single commercial relationship that alone exceeds the total passenger revenue of many mid-sized carriers.
United’s loyalty revenue reached USD 1.5 billion in Q1 2025 alone, reflecting consistent double-digit annual growth. The five largest U.S. carriers combined — Alaska, American, Delta, Southwest, and United — posted USD 28 billion in loyalty revenue in 2024, per IdeaWorksCompany’s 2024 yearbook, generating an average of USD 35.48 per passenger across their combined networks. The pandemic underscored how central these programmes have become: United raised USD 6.8 billion by securitising MileagePlus, Delta borrowed USD 9 billion against SkyMiles, and American secured USD 10 billion using AAdvantage as collateral.
.jpg)
Air Cargo is the USD 158 Billion Profit Engine
Air cargo occupies a peculiar position in the public imagination of aviation — ignored by most travellers, yet responsible for transporting approximately 35 percent of global trade by value on a fraction of its volume. IATA’s December 2025 forecast projects cargo revenue of USD 158 billion in 2026, up 2.1 percent from USD 155 billion in 2025, with cargo tonne kilometres (CTK) growing 2.6 percent — driven by time-sensitive e-commerce shipments, pharmaceutical cold-chain logistics, and the rerouting of surface freight away from disrupted maritime routes.
The IATA 2026 profitability forecast describes air cargo as “the hero of global trade” — language that reflects both its financial contribution and its structural resilience, as cargo demand proved far less sensitive to the economic uncertainties of 2025 than passenger demand.
Airlines earn cargo revenue through two structurally distinct mechanisms. Pure freighter operators — FedEx (FX), UPS Airlines (5X), Qatar Airways Cargo, and Cargolux (CV) — operate dedicated freight aircraft with no passenger configuration, maximising cubic capacity and range for high-density freight corridors. Passenger carriers earn belly cargo revenue by selling the space below the passenger cabin floor that would otherwise fly empty — a revenue stream that requires no incremental fuel burn above what the passenger flight already consumes, making it structurally higher-margin than the ticket revenue sharing the same flight.
Some sources claim that cargo contributes 30 to 35 percent of airline flight revenues — a figure most consistent with the economics of major international carriers where belly space on widebody long-haul flights is systematically sold to freight forwarders, express integrators, and direct shippers. Sometimes even animals such as lions are transported in the cargo hold of an aircraft.
Commission Income, Charter Operations, And Other Non-Ticket Revenue
Beyond the three primary revenue streams, airlines generate meaningful income through commission-based commercial partnerships and operational services that rarely appear in passenger-facing marketing. Hotel referrals, car rental commissions, and travel insurance sales through the airline booking pathway collectively generate hundreds of millions in commission income annually for major carriers. Commission revenue from third-party providers are established ancillary income category.
Charter operations constitute a separate and occasionally substantial revenue stream for carriers with appropriate fleet flexibility. Airlines operating on behalf of sports teams, corporate clients, government entities, and tour operators on non-scheduled charter flights generate per-hour revenue substantially above typical scheduled service yields. This is because the client pays for the entire aircraft regardless of occupancy, eliminating the load factor risk that governs scheduled operation economics.
Aircraft leasing (both wet lease, where the aircraft, crew, maintenance, and insurance are all provided, and dry lease, where only the aircraft is delivered) allows airlines with surplus capacity to monetize assets that would otherwise sit idle, generating lease income while reducing the carrying cost of a temporarily underutilized fleet.
Pilot and crew training services, maintenance repair and overhaul (MRO) operations offered to third parties, and ground handling services at dominated airports complete the revenue architecture of the most diversified carriers.
Why Do Airlines Still Have Such Thin Margins?
The apparent paradox of a USD 979 billion industry earning a 3.9 percent net margin resolves when the cost structure is examined with the same granularity as the revenue architecture. IATA’s 2025 outlook places fuel costs at USD 252 billion — 25.7 percent of total operating expenses — even as oil prices remain below the catastrophic 2022 peaks.
Labour costs have overtaken fuel as the largest single expense category for U.S. carriers: DWU Consulting’s labour economics analysis confirms that labour now constitutes 36.8 percent of total U.S. airline operating expenses, with widebody captains at major carriers earning USD 450,000 to USD 500,000 annually.
Airport charges, maintenance, ownership costs — aircraft depreciation and lease payments — customer service, distribution, and regulatory compliance layer additional fixed costs onto a business whose revenue is simultaneously suppressed by fierce competition on every route.
IATA’s polling data for 2025 shows approximately 97 percent of passengers report satisfaction with the air travel experience — a remarkable endorsement of a product that delivers passengers from continent to continent for less than the inflation-adjusted cost of the same journey in 2014, while the industry that provides it earns less per passenger than the price of a single airport sandwich.