A new global aviation emissions study has identified Dubai International Airport (DXB) and Heathrow Airport (LHR) as the world’s two highest-emitting airports, highlighting the aviation sector’s rapid return to near pre-pandemic pollution levels.
The findings, published by ODI Global through its Airport Tracker initiative, analyzed more than 1,300 airports worldwide and revealed that the top 20 airports alone were responsible for 27.3% of all aviation-related CO2 emissions in 2023.
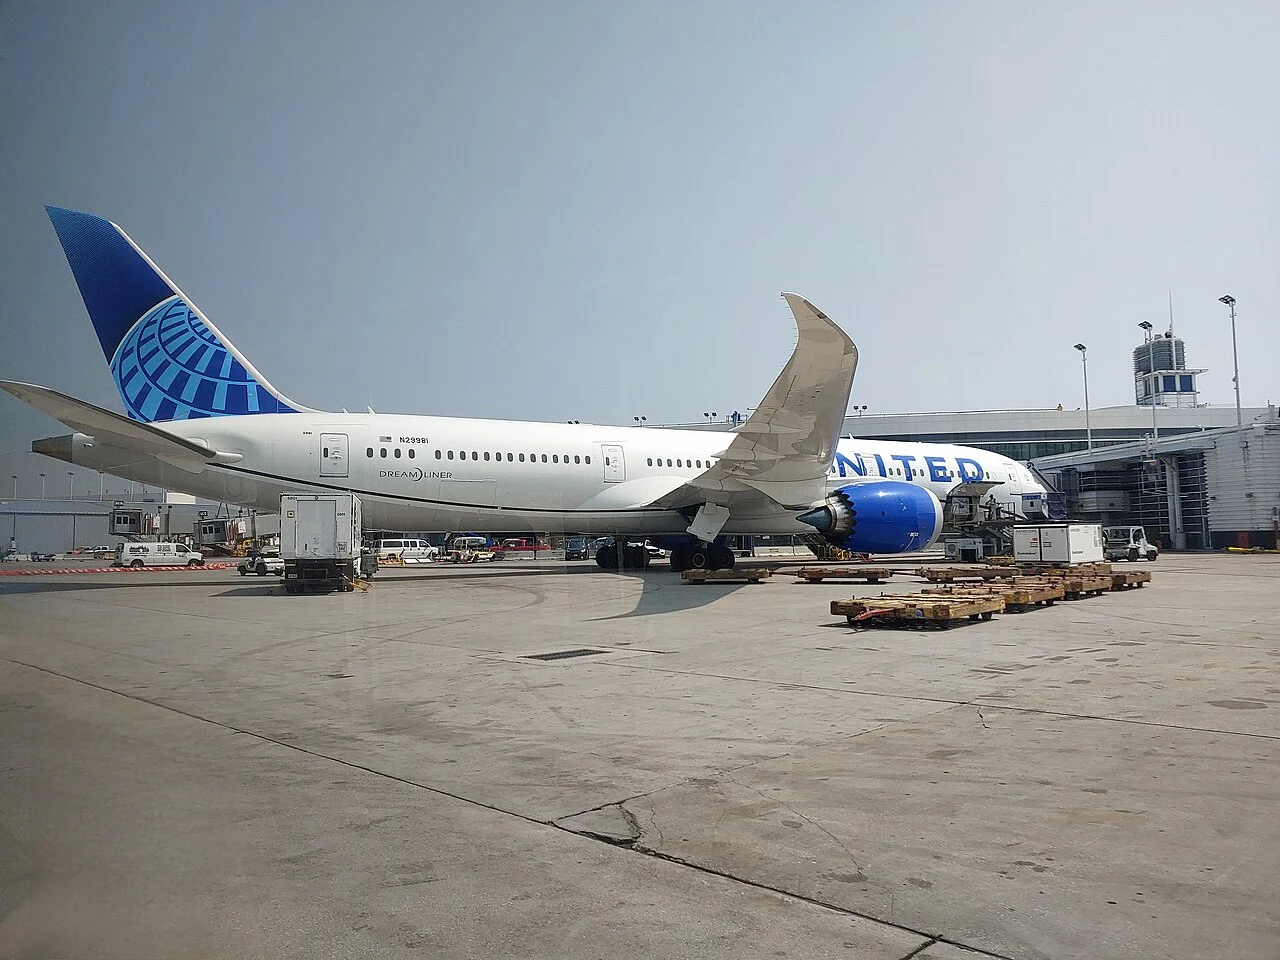
Airlines operating major long-haul networks — including Emirates, British Airways, American Airlines, and Singapore Airlines — contribute heavily to emissions at these global hubs.
The report also found that airports in just 20 countries generated 78% of worldwide aviation CO2 emissions, with the United States and China together accounting for nearly 40% of the global total.
Aviation Emissions Continue Climbing
According to the analysis, aviation now contributes roughly 2.5% of global energy-related carbon dioxide emissions. When additional climate effects beyond CO2 are included, aviation’s contribution to global warming rises to approximately 4%.
ODI Global estimated that airports tracked in the study produced 1,026 million tonnes of CO2 from 34.6 million flights during 2023. Researchers noted that aviation recorded the fastest emissions growth among major hard-to-abate industries between 2023 and 2024.
Hard-to-Abate Sector Comparison (2023-2024)
| Sector | Activity (2024) | YoY Activity Change | Emissions (Gt CO2) | YoY Emissions Change |
|---|---|---|---|---|
| Aviation | 8.8 trillion revenue passenger-km | +10.4% | 1.108 | +6.4% |
| Shipping | 121.7 trillion tonne-km | +5.5% | 0.847 | +2.7% |
| Trucking | 35.1 trillion tonne-km | +1.3% | 1.968 | +0.6% |
| Steel | 1,883 million tonnes | -1.1% | 2.750 | -0.4% |
| Aluminium | 113 million tonnes | +4.6% | 1.162 | +4.1% |
| Cement | 3,950 million tonnes | -3.9% | 2.324 | -3.5% |
| Primary Chemicals | 754 million tonnes | +3.0% | 0.971 | +2.3% |
| Oil and Gas | 103M barrels/day; 411B cubic ft/day | +4.0% / +1.5% | 5.100 | -6.4% |
Asia-Pacific Leads Global Aviation Pollution
The Asia-Pacific region emerged as the largest contributor to aviation emissions globally, ahead of North America and Europe. Together, the three regions account for the overwhelming majority of worldwide aviation pollution.
Regional Breakdown of Aviation Emissions
| Region | CO2 Emissions (Million Tonnes) | % of Total Emissions | Flights (Million) | % of Total Flights |
|---|---|---|---|---|
| Asia-Pacific | 331.6 | 32% | 10.4 | 30% |
| North America | 281.8 | 27% | 11.2 | 33% |
| Europe | 245.9 | 24% | 8.3 | 24% |
| Latin America/Caribbean | 67.2 | 7% | 2.7 | 8% |
| Middle East | 71.6 | 7% | 1.2 | 4% |
| Africa | 27.6 | 3% | 0.7 | 2% |
Dubai and Heathrow Top Global Airport Emissions Rankings
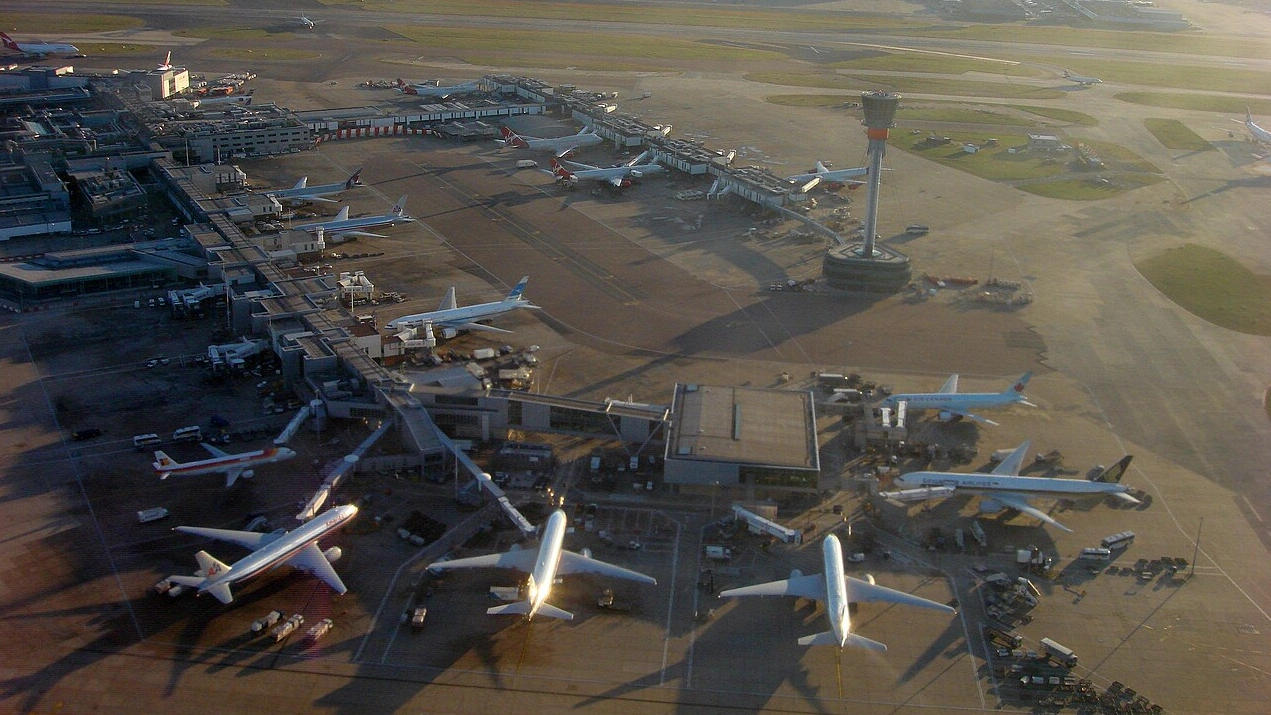
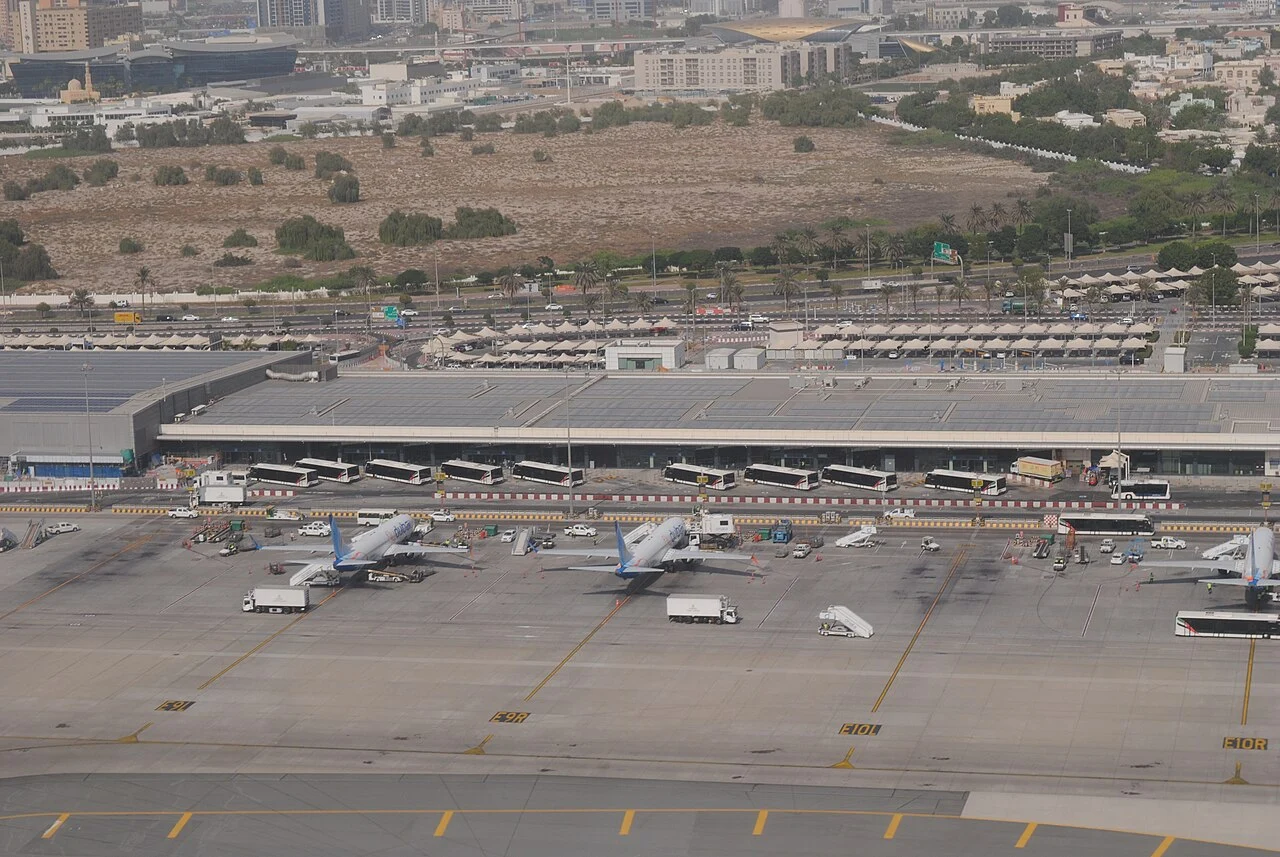
Dubai International Airport recorded the highest airport-related aviation emissions in 2023 at 23.2 million tonnes of CO2. Heathrow Airport, which might have its third runway, followed closely behind at 21.0 million tonnes.
The rankings show the dominance of large international hubs handling significant long-haul traffic. Eight of the top 20 airports are located in the United States, while 18 are situated in high-income economies.
Top 20 Highest-Emitting Airports in 2023
| Rank | Airport Name | IATA Code | Country/Territory | ICAO Region | CO2 (Million Tonnes) |
|---|---|---|---|---|---|
| 1 | Dubai International | DXB | United Arab Emirates | Middle East | 23.2 |
| 2 | London Heathrow | LHR | United Kingdom | Europe | 21.0 |
| 3 | Los Angeles International | LAX | United States | North America | 18.8 |
| 4 | Seoul Incheon | ICN | South Korea | Asia/Pacific | 16.8 |
| 5 | New York John F. Kennedy | JFK | United States | North America | 16.8 |
| 6 | Hong Kong International | HKG | China | Asia/Pacific | 15.1 |
| 7 | Paris Charles de Gaulle | CDG | France | Europe | 14.7 |
| 8 | Frankfurt | FRA | Germany | Europe | 14.4 |
| 9 | Singapore Changi | SIN | Singapore | Asia/Pacific | 14.3 |
| 10 | Doha Hamad | DOH | Qatar | Middle East | 14.0 |
| 11 | Istanbul | IST | Türkiye | Europe | 12.8 |
| 12 | Shanghai Pudong | PVG | China | Asia/Pacific | 12.4 |
| 13 | Chicago O’Hare | ORD | United States | North America | 12.4 |
| 14 | San Francisco | SFO | United States | North America | 11.9 |
| 15 | Amsterdam Schiphol | AMS | Netherlands | Europe | 11.0 |
| 16 | Tokyo Haneda | HND | Japan | Asia/Pacific | 10.8 |
| 17 | Atlanta Hartsfield-Jackson | ATL | United States | North America | 10.6 |
| 18 | Anchorage | ANC | United States | North America | 9.9 |
| 19 | Miami International | MIA | United States | North America | 9.7 |
| 20 | Dallas/Fort Worth | DFW | United States | North America | 9.4 |

United States and China Dominate National Emissions Totals
The report showed that the United States alone generated one-quarter of global airport CO2 emissions. China ranked second with 13%, while the United Kingdom, Japan, and the United Arab Emirates rounded out the top five.
Country-Level Aviation Emissions Rankings
| Rank | Country | CO2 (Million Tonnes) | % of Total | Cumulative % |
|---|---|---|---|---|
| 1 | United States | 259.4 | 25% | 25% |
| 2 | China | 138.2 | 13% | 39% |
| 3 | United Kingdom | 38.5 | 4% | 43% |
| 4 | Japan | 32.0 | 3% | 46% |
| 5 | United Arab Emirates | 31.1 | 3% | 49% |
| 6 | Germany | 29.0 | 3% | 52% |
| 7 | India | 27.6 | 3% | 54% |
| 8 | Spain | 24.7 | 2% | 57% |
| 9 | France | 23.6 | 2% | 59% |
| 10 | Australia | 22.0 | 2% | 61% |
| 11 | Canada | 22.0 | 2% | 63% |
| 12 | Türkiye | 20.9 | 2% | 65% |
| 13 | South Korea | 19.8 | 2% | 67% |
| 14 | Russia | 18.4 | 2% | 69% |
| 15 | Brazil | 17.8 | 2% | 71% |
| 16 | Italy | 16.1 | 2% | 72% |
| 17 | Mexico | 15.5 | 2% | 74% |
| 18 | Singapore | 14.3 | 1% | 75% |
| 19 | Qatar | 14.0 | 1% | 77% |
| 20 | Thailand | 13.7 | 1% | 78% |
| – | Rest of World | 226.9 | 22% | 100% |
US Airports Dominate Flight Volume Rankings
American airports overwhelmingly dominate the global rankings for aircraft movements, reflecting the scale of the country’s domestic aviation market and reliance on short-haul connectivity. After all, the three biggest airlines in terms of fleet hail from the US.
Top 20 Airports by Flight Volume
| Rank | Airport Name | IATA Code | Country/Territory | ICAO Region | Number of Flights |
|---|---|---|---|---|---|
| 1 | Atlanta Hartsfield-Jackson | ATL | United States | North America | 391,183 |
| 2 | Chicago O’Hare | ORD | United States | North America | 363,173 |
| 3 | Dallas/Fort Worth | DFW | United States | North America | 348,035 |
| 4 | Denver International | DEN | United States | North America | 332,071 |
| 5 | Los Angeles International | LAX | United States | North America | 288,622 |
| 6 | Charlotte Douglas | CLT | United States | North America | 264,183 |
| 7 | Las Vegas Harry Reid | LAS | United States | North America | 252,170 |
| 8 | Istanbul | IST | Türkiye | Europe | 249,788 |
| 9 | New York John F. Kennedy | JFK | United States | North America | 240,978 |
| 10 | Miami International | MIA | United States | North America | 231,068 |
| 11 | London Heathrow | LHR | United Kingdom | Europe | 229,941 |
| 12 | Amsterdam Schiphol | AMS | Netherlands | Europe | 228,994 |
| 13 | Tokyo Haneda | HND | Japan | Asia/Pacific | 228,361 |
| 14 | Paris Charles de Gaulle | CDG | France | Europe | 228,131 |
| 15 | Delhi Indira Gandhi | DEL | India | Asia/Pacific | 225,068 |
| 16 | Phoenix Sky Harbor | PHX | United States | North America | 222,634 |
| 17 | Guangzhou Baiyun | CAN | China | Asia/Pacific | 222,196 |
| 18 | Newark Liberty | EWR | United States | North America | 218,540 |
| 19 | Shanghai Pudong | PVG | China | Asia/Pacific | 215,210 |
| 20 | Frankfurt | FRA | Germany | Europe | 214,577 |
London Leads City-Level Airport Emissions
At the city level, London ranked first globally for combined airport emissions. The British capital’s six airports handled more than 547,000 flights and produced 29.2 million tonnes of CO2.
New York City and Dubai followed closely behind in the rankings.
Top 20 Cities by Aggregated Airport Emissions (Traffic & CO2)
| Rank | City | City Code | Airports | Flights | CO2 (Million Tonnes) |
|---|---|---|---|---|---|
| 1 | London | LON | 6 | 547,501 | 29.2 |
| 2 | New York City | NYC | 4 | 651,054 | 28.5 |
| 3 | Dubai | DXB | 2 | 227,127 | 24.8 |
| 4 | Tokyo | TYO | 2 | 333,164 | 19.8 |
| 5 | Los Angeles | LAX | 2 | 323,307 | 19.1 |
| 6 | Paris | PAR | 4 | 376,808 | 18.6 |
| 7 | Seoul | SEL | 2 | 241,712 | 17.8 |
| 8 | Shanghai | SHA | 2 | 347,765 | 16.7 |
| 9 | Hong Kong | HKG | 1 | 138,764 | 15.1 |
| 10 | Istanbul | IST | 2 | 365,004 | 15.0 |
| 11 | Frankfurt | FRA | 2 | 221,794 | 14.8 |
| 12 | Singapore | SIN | 1 | 164,862 | 14.3 |
| 13 | Chicago | CHI | 2 | 475,277 | 14.1 |
| 14 | Doha | DOH | 1 | 124,340 | 14.0 |
| 15 | Beijing | BJS | 2 | 333,083 | 13.2 |
| 16 | San Francisco | SFO | 1 | 189,762 | 11.9 |
| 17 | Amsterdam | AMS | 1 | 228,994 | 11.0 |
| 18 | Dallas Fort Worth | DFW | 2 | 469,594 | 10.9 |
| 19 | Bangkok | BKK | 2 | 246,246 | 10.8 |
| 20 | Atlanta | ATL | 2 | 420,658 | 10.7 |
Top 20 Cities by Airport Air Pollutants
| Rank | City | NOx (Tonnes) | HC (Tonnes) | CO (Tonnes) | PM2.5 (Tonnes) |
|---|---|---|---|---|---|
| 1 | London | 9,571 | 556 | 5,910 | 36 |
| 2 | New York City | 8,865 | 535 | 5,873 | 38 |
| 3 | Dubai | 8,039 | 498 | 4,764 | 20 |
| 4 | Tokyo | 7,501 | 410 | 4,283 | 24 |
| 5 | Los Angeles | 5,083 | 486 | 3,533 | 23 |
| 6 | Paris | 6,314 | 526 | 4,528 | 24 |
| 7 | Seoul | 5,690 | 299 | 3,233 | 22 |
| 8 | Shanghai | 6,924 | 390 | 4,368 | 27 |
| 9 | Hong Kong | 4,572 | 245 | 2,535 | 14 |
| 10 | Istanbul | 6,276 | 353 | 3,811 | 30 |
| 11 | Frankfurt | 4,197 | 250 | 2,716 | 19 |
| 12 | Singapore | 4,501 | 188 | 2,316 | 15 |
| 13 | Chicago | 4,949 | 442 | 4,173 | 24 |
| 14 | Doha | 4,569 | 200 | 2,287 | 10 |
| 15 | Beijing | 6,011 | 365 | 3,935 | 25 |
| 16 | San Francisco | 3,112 | 184 | 1,906 | 13 |
| 17 | Amsterdam | 3,251 | 292 | 2,708 | 12 |
| 18 | Dallas Fort Worth | 4,722 | 456 | 3,749 | 30 |
| 19 | Bangkok | 4,740 | 274 | 2,918 | 19 |
| 20 | Atlanta | 4,884 | 384 | 3,991 | 25 |
Top 20 Airports by NOx Emissions (LTO Cycle)
| Rank | Airport | Tonnes |
|---|---|---|
| 1 | Dubai (DXB) | 7,577 |
| 2 | London Heathrow (LHR) | 6,030 |
| 3 | Istanbul (IST) | 5,018 |
| 4 | Los Angeles (LAX) | 4,866 |
| 5 | Tokyo Haneda (HND) | 4,826 |
| 6 | Seoul Incheon (ICN) | 4,800 |
| 7 | Atlanta (ATL) | 4,756 |
| 8 | Paris CDG (CDG) | 4,666 |
| 9 | Hong Kong (HKG) | 4,572 |
| 10 | Doha Hamad (DOH) | 4,569 |
| 11 | Singapore Changi (SIN) | 4,501 |
| 12 | New York JFK (JFK) | 4,474 |
| 13 | Shanghai Pudong (PVG) | 4,193 |
| 14 | Guangzhou (CAN) | 4,082 |
| 15 | Frankfurt (FRA) | 4,080 |
| 16 | Chicago O’Hare (ORD) | 3,964 |
| 17 | Beijing Capital (PEK) | 3,926 |
| 18 | Dallas/Fort Worth (DFW) | 3,777 |
| 19 | Bangkok (BKK) | 3,689 |
| 20 | Miami (MIA) | 3,381 |
Top 20 Airports by CO Emissions (LTO Cycle)
| Rank | Airport | Tonnes |
|---|---|---|
| 1 | Dubai (DXB) | 4,404 |
| 2 | Atlanta (ATL) | 3,663 |
| 3 | Chicago O’Hare (ORD) | 3,207 |
| 4 | Los Angeles (LAX) | 3,101 |
| 5 | Paris CDG (CDG) | 3,085 |
| 6 | Istanbul (IST) | 2,948 |
| 7 | London Heathrow (LHR) | 2,829 |
| 8 | Tokyo Haneda (HND) | 2,797 |
| 9 | Shanghai Pudong (PVG) | 2,740 |
| 10 | New York JFK (JFK) | 2,733 |
| 11 | Amsterdam (AMS) | 2,708 |
| 12 | Guangzhou (CAN) | 2,665 |
| 13 | Seoul Incheon (ICN) | 2,649 |
| 14 | Dallas/Fort Worth (DFW) | 2,632 |
| 15 | Frankfurt (FRA) | 2,620 |
| 16 | Denver (DEN) | 2,618 |
| 17 | Hong Kong (HKG) | 2,535 |
| 18 | Beijing Capital (PEK) | 2,485 |
| 19 | Miami (MIA) | 2,324 |
| 20 | Singapore Changi (SIN) | 2,316 |
Long-Haul Flights Produce Outsized Climate Impact
Although long-haul flights accounted for only 7% of global flights, they generated 40% of total aviation CO2 emissions. Passenger services dominated the sector overall, contributing 87% of climate impact.
Flight Type and Climate Impact Distribution
| Flight Category | % of Total Flights | % of Climate Impact |
|---|---|---|
| Passenger | 90% | 87% |
| Freight | 4% | 11% |
| Private Jet | 6% | 2% |
Flight Distance and Emissions Impact
| Flight Distance | % of Total Flights | % of CO2 Emissions |
|---|---|---|
| Short-haul | 63% | – |
| Medium-haul | 30% | – |
| Long-haul | 7% | 40% |
Airport Carbon Accreditation Status (March 2026)
| Accreditation Level | Number of Airports | % of Tracked Airports |
|---|---|---|
| Total accredited (all levels) | 650 | 50.0% |
| Level 5 (Net-zero Scope 3 by 2050) | 30 | 2.3% |