A report from Forbes pointed out that 2024 was “the deadliest in commercial aviation in six years.” This came against a backdrop of 2023 being the safest year for flying (as reported by IATA). 2025 has seen a number of crashes already- the most notable of them all being the collision between an American Airlines commercial aircraft and a military Black Hawk helicopter (outside Ronald Reagan Washington National Airport), marking what USA Today called “the first high-profile commercial aviation crash in 15 years“. But what is the total inflight passenger fatalities to date? Let’s find out.
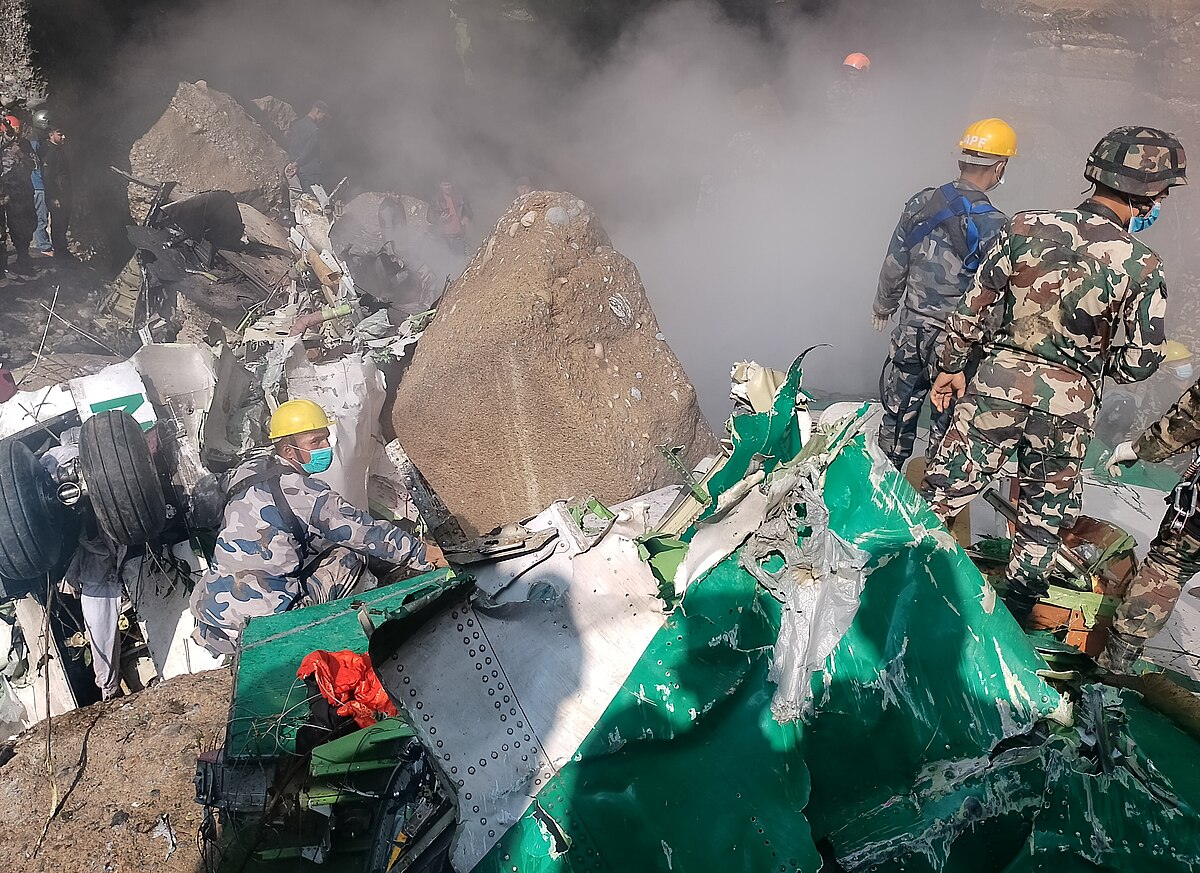
Photo: Bhupendra Shrestha | Wikimedia Commons
Key Takeaways
- Despite fluctuations in annual figures, there has been a general downward trend in inflight passenger fatalities over recent years.
- Safety metrics such as accident rates per million flights have improved, “decreasing from 3.72 accidents per million sectors in 2005 to 1.13 in 2024.”, as reported by IATA.
- Human factors, including pilot training and error such as the removal of “Remove Before Flight Tag“, or the failure of regulatory bodies to control crashes, as evidenced in Lukla Airport, which is considered to be the most dangerous airport in the world.
- Technological advancements and predictive analytics are expected to further enhance safety in the future of air travel.
Historical Overview of Inflight Passenger Fatalities
Trends in Fatal Accidents Over the Years
When examining the trends in inflight passenger fatalities, a key question often arises: What is the major cause of inflight deaths? While the intricacies and subtleties regarding what the data point towards vary from year to year, a consistent observation is the decline in fatal accidents.

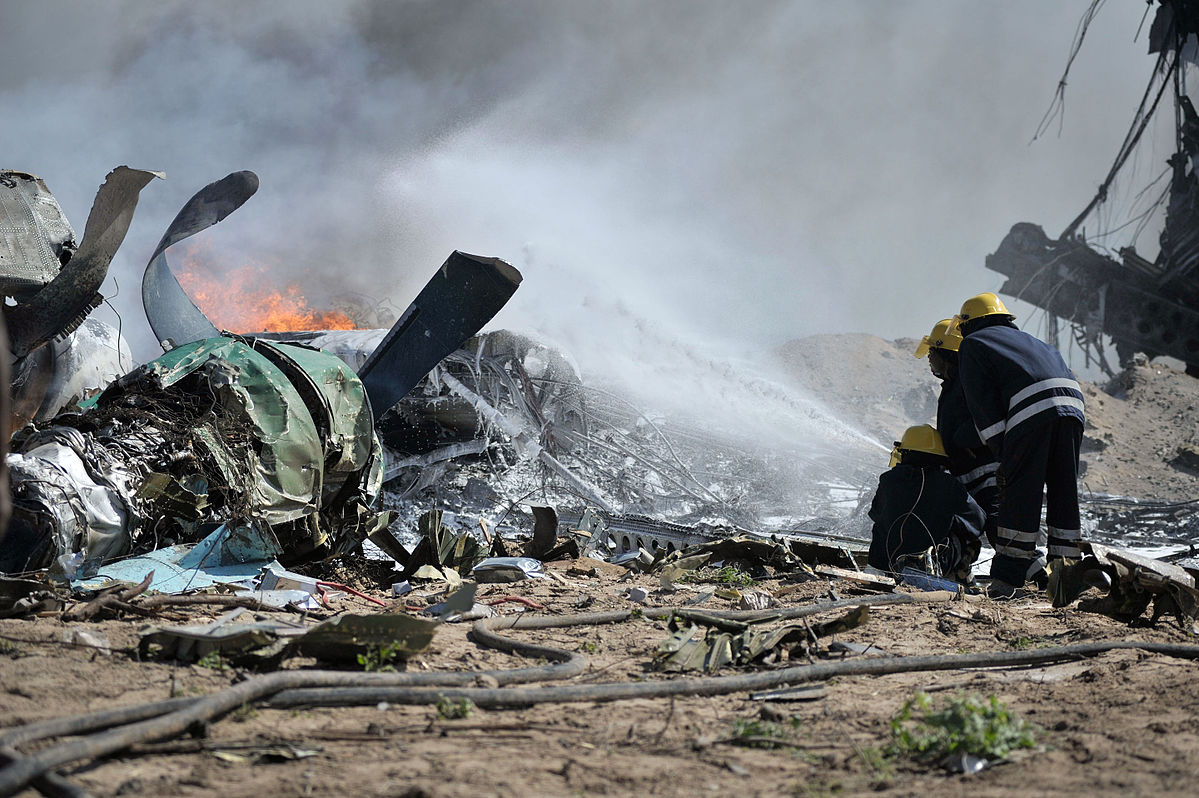
Photo: National Archives and Records Administration | Wikimedia Commons
Are there any specific aged people that are more susceptible to inflight deaths? Research does not conclusively point to age as a significant factor in susceptibility to inflight fatalities. Instead, the focus is often on the broader safety measures and the effectiveness of regulatory oversight.
The following table summarizes recent trends in accident rates and fatalities:
| Year | Accidents | Fatal Accidents | Fatalities |
| 2022 | 42 | 5 (one jet and four turboprop) | 158 |
| 2023 | 30 | 1 (0 jet and one turboprop) | 72 |
According to the analysis done by IATA, “The fatality risk rose from 0.03 in 2023 to 0.06 in 2024, which is still below the five-year average of 0.10 for the period 2020-2024” However, the details behind the statistics change if you’re taking a ten-year average:
” Taking a longer-term view, the industry has significantly improved its 5-year rolling average accident rate per million sectors, decreasing from 2.20 for the period 2011-2015 to 1.25 for 2020-2024. Similarly, the 5-year average fatality risk rate has improved from 0.28 (2011-2015) to 0.10 for the past five years. Over this period, there have been an average of about five fatal accidents per year for commercial aircraft (passenger and cargo), resulting in an annual average of 144 fatalities.”
.jpg)
Comparative Analysis data related to in-flight fatalities
In 2023, the aviation community had recorded merely 126 fatalities in commercial flights. The next year, the figure was 318. The last week of 2024 saw two accidents -one in Korea and the other one in Kazakhstan. Barring the two mishaps, 2024 could have been a relatively safe year but these accidents made 2024 the deadliest year for commercial aviation since 2018.
The aviation accident in Kazakhstan at the end of 2024 was the result of a missile hitting the aircraft. New York Post even had a story that read that missiles were the biggest killer of passenger planes. Over the last decade, missiles have resulted in the death of more than 500 passengers.

Photo: NASA | Wikimedia Commons
While the aviation industry can draw some solace from the fact that a missile attack can’t be associated with occurences such as the MCAS system errors or mechanical failures of aircraft – it doesn’t point at something more serious: “With Russia- Ukraine war still taking place, and the violence in Israel and Palestine erupted, does it mean that commercial aircraft might see more of such fatalities? [The Russia-Ukraine war also led to the desecration of the lone Antonov An-225, alongside other beautiful aircraft.]
Understanding the Safety Metrics
Accident Rates Per Million Flights
Boeing’s report on how accident rates have changed over the past five decades (1974‑2023), statistics show that accident rates continue to decline:
” • Accident rate: 45% decline
• Hull loss rate: 58% decline
• Fatal accident rate: 68% decline
• Departures: 25% increase”
Boeing also reported that since almost the turn of the millennium, “accidents dropped by about 30%; hull losses dropped by nearly 50%; and fatal accidents dropped by 60%.” From 1959 – 2023, there have been 2,134 total accidents, 70% of which have been non-fatal. 28 of the 635 accidents have been the ones with substantial damage. The total number of fatalities (including xternal fatalities such as on-ground fatalities as well as fatalities on other aircraft involved) was 29,643 – 810 of which were not passengers.
On the other hand, from 2014-2023, there were 279 total accidents, out of which 28 were fatal. During this time, 1,066 fatalities were recorded. 19 of these were not passengers.
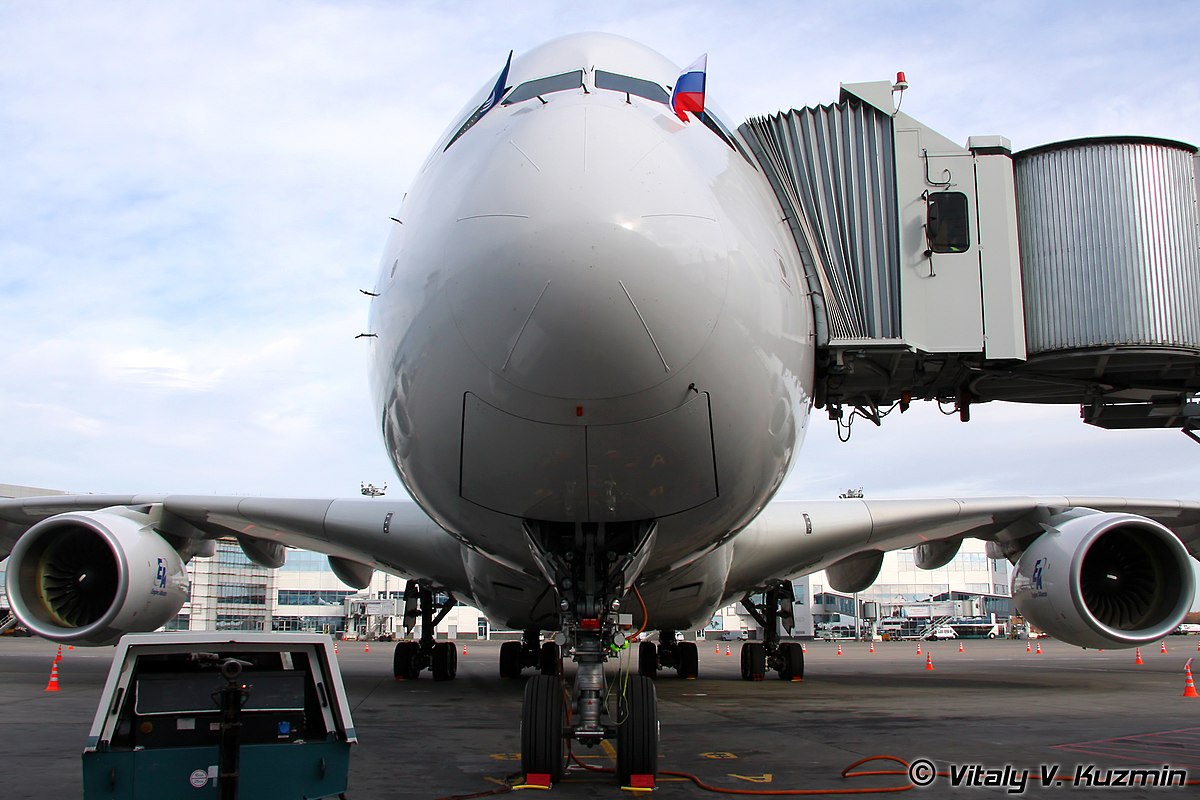
Photo: Vitaly V.Kuzmin/ Wikimedia Commons
_at_Domodedovo_International_Airport_(248-17).jpg)
But accident rates are generally expressed in terms of the number of crashes per million flights. Here’s IATA’s breakdown of numbers:
“The accident rate was 0.80 per million sectors in 2023 (one accident for every 1.26 million flights), an improvement from 1.30 in 2022 and the lowest rate in over a decade. This rate outperformed the five-year (2019-2023) rolling average of 1.19 (an average one accident for every 880,293 flights). “
Although the numbers might sound scary, Arnold Barnett, M.I.T’s Sloan School Statistician’s exposition about how rare plane crashes are might be apt to describe the safety of airplanes:
“If you take one flight a day, you would on average need to fly every day for 55,000 years before being involved in a fatal crash,”
Aircraft Owners and Pilots Association (AOPA) also reported a year or so ago that despite the rise in overall crash rate, deadly crashes have been going down – though the reports did not present accident rate per million flights, but instead in “rate per 100,000 flight hours“:
“In 2022, non-commercial fixed-wing aircraft had 965 total crashes, of which 157 were deadly. The overall number of crashes rose from 934 to 965, but with an increase in flight activity in this category, the total crash rate per 100,000 hours showed a downward trend, from 4.85 to 4.84. Deadly crashes dropped in 2022 from 164 to 157, and the rate per 100,000 flight hours dropped from 0.85 to 0.79. The percentage of pilot-related crashes remained around 70 percent. These consisted of 708 total, of which 117 were fatal.”
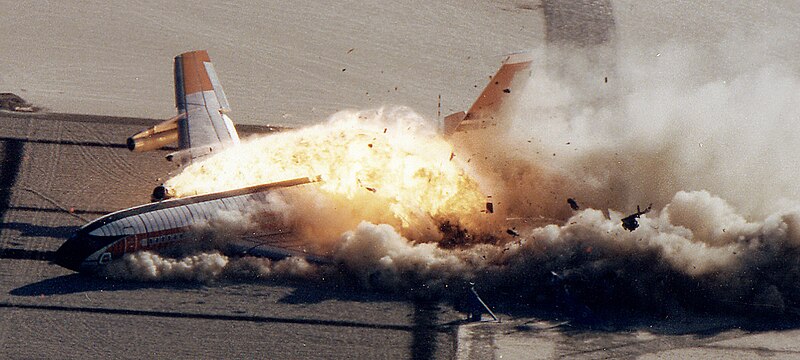
Photo: NASA | Wikimedia Commons
The Role of Aircraft Type in Safety
The type of aircraft plays a significant role in aviation safety, with different models showcasing varying safety records. The Flight Safety Foundation’s 2023 Safety Report emphasizes this point. The report highlighted how there were no commercial jet airliner
fatal accidents in 2023 while seven turboprop and piston engine airliners were involved in fatal accidents. According to the report:
“Those seven accidents, five of which involved Cessna 208 Caravans, resulted in 107 fatalities among passengers and crew and one ground fatality. Three of the fatal accidents occurred in nonscheduled passenger operations, one in scheduled passenger operations and one in cargo operations.”
AOPA’s report that we cited previously also emphasized on something similar. Here’s a synopsis of this report (of 2022) that we had previously touched upon
- Commercial fixed-wing crashes: 63, nine of which were deadly.
- Non-commercial fixed-wing: 965 total crashes, 157 of which were deadly
- Non-commercial helicopter: 82 total crashes, 11 of which were fatal
- Commercial helicopter: 43, of which six were deadly

Photo: Airbus
In 2019, the safety landscape showed improvements, with a decrease in fatal accidents compared to the previous year. The report highlights that of the 53 accidents that year, only eight were fatal, resulting in 240 fatalities. This was a notable improvement from 2018, where 11 fatal accidents claimed 523 lives. The data underscores the importance of aircraft performance and systems reliability in ensuring passenger safety.
The continuous advancements in aircraft design, including safety features and systems like the Maneuvering Characteristics Augmentation System (MCAS), are crucial. However, two crashes of the Boeing 737 MAX that had MCAS also illustrated the potential risks when system flaws. Unexpected activation due to erroneous data coupled with inadequate pilot training can really take the aviation community by storm, as was evidenced by the two crashes – Lion Air Flight 610 and Ethiopian Airlines Flight 302 – that resulted in the tragic loss of 346 lives.
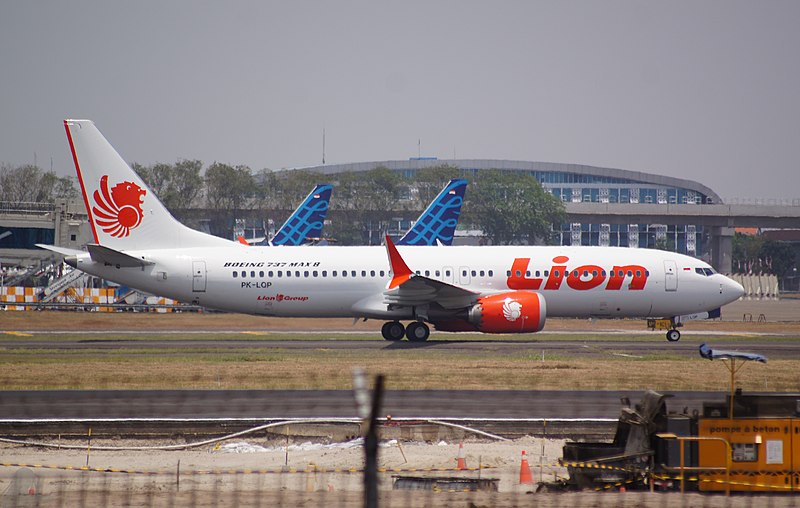
Photo: PK-REN | Wikimedia Commmons
A US based publication called The Points Guy analyzed the safety on each mode of air transportation in the U.S., and came up with a metric known as the “death index”. The publication suggested that if passenger airlines had been assigned the base figure i.e., Death Index 1, non-scheduled helicopters had a Death Index of 63. But before we get caught up in making generalizations about the safety of helicopters vs fixed-wing, we have to keep in mind that choppers are involved in many risky search and rescue missions. An Airbus A350 B3E even landed at the top of Mt. Everest- something that passenger airliners would never dare to do.
An analysis of the crashes of emergency medical services (EMS) crashes between January 1, 1983, and April 30, 2005, revealed that the time of the day when the chopper was operated on the mission had profound effects on the safety issue:
“ There were 182 helicopter EMS crashes during the 22.3-year study period; 39% were fatal. One hundred eighty-four occupants died: 45% of the 44 patients and 32% of the 513 crewmembers. Fifty-six percent of crashes in darkness were fatal compared with 24% of crashes not in darkness. Seventy-seven percent of crashes in instrument meteorological conditions were fatal compared with 31% in visual conditions.”
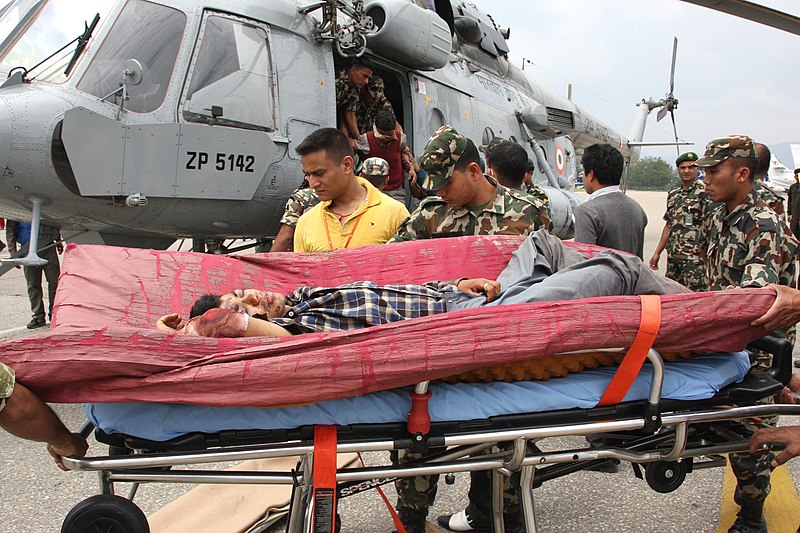
Photo: Ministry of Defence | Wikimedia Commons
IATA’s Safety Indicators and Their Improvements
The International Air Transport Association (IATA) has been instrumental in enhancing aviation safety through various initiatives and data-driven approaches. The Safety Issue Hub and dashboard are pivotal in supporting the identification, analysis, and mitigation of risks for the aviation industry. This tool allows for a more nuanced understanding of safety concerns and the development of targeted solutions.
Additionally, the IATA Global Aviation Data Management (GADM) program has seen increased participation, with over 90 airlines now reporting dangerous good incident data. This collective effort is crucial for improving risk management and advocacy capabilities within the industry.