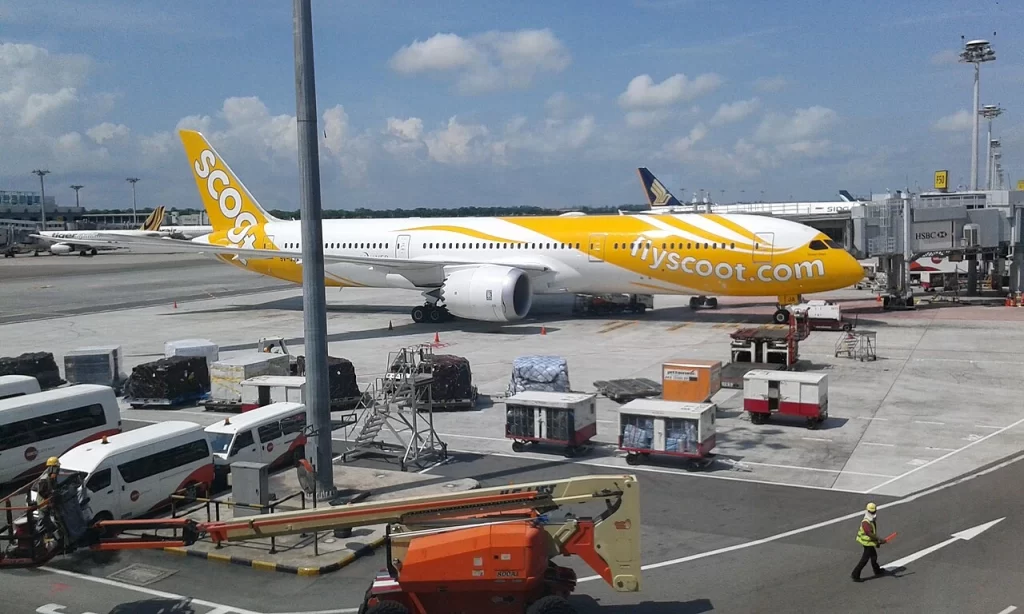
Singapore-based low-cost carrier Scoot Airways (TR) has been named the world’s most emissions-efficient airline in the 2025 EmeraldSky Annual Review by Cirium, as the airline achieved a CO₂ intensity of 51 grams per available seat kilometre (ASK), overtaking Wizz Air (W6).
The rankings evaluate the world’s 100 largest airlines based on CO₂ emissions per available seat kilometre (ASK). The methodology has been independently verified by PwC in accordance with ISAE 3000 standards. Airlines are then classified into Gold, Silver, and Bronze categories according to their overall performance, highlighting not only the top 15 carriers globally but also leading performers across specific regions and routes.
Low-Cost Carriers Dominate Efficiency Rankings
While low-cost carriers dominate emissions rankings due to structural advantages like dense seating and high utilization, several have also introduced targeted environmental initiatives.
At Scoot, sustainability efforts extend beyond operational design. The airline has implemented fuel-efficiency measures such as reducing contingency fuel loads on Boeing 787 flights, lowering aircraft weight and fuel burn per journey.
Scoot also participates in broader sustainability programs through its parent group, including digitalisation to reduce onboard paper weight, voluntary carbon offset programmes for passengers, and the adoption of ICAO’s CORSIA emissions framework. The following table gives us a cue about Scoot’s sustainability measure:
| Initiative Area | Specific Measure | Details / What Was Done | Environmental Impact |
|---|---|---|---|
| Fleet Modernisation | Introduction of next-generation aircraft | Scoot operates a relatively young fleet (~6 years average age) and is adding Boeing 787 Dreamliners, Airbus A320neo/A321neo, and Embraer E190-E2 aircraft | Up to 20% lower fuel consumption vs older aircraft; reduced CO₂ emissions and noise |
| Aircraft Design Efficiency | Use of advanced materials & aerodynamics | New aircraft incorporate composite materials (lighter structure) and streamlined aerodynamic design | Reduced drag → lower fuel burn per flight |
| Fuel Efficiency Operations | Reduction of contingency fuel | Contingency fuel reduced from 5% to 3% on selected Boeing 787 flights (since April 2021), in consultation with CAAS | Lower aircraft weight → reduced fuel consumption per flight |
| Carbon Market Mechanism | Participation in CORSIA | Scoot (via SIA Group) participates in ICAO’s Carbon Offsetting and Reduction Scheme for International Aviation (CORSIA) | Offsets growth in international aviation emissions through global carbon markets |
| Carbon Offsetting | Voluntary Carbon Offset Programme | Customers can calculate and offset emissions from their flights via verified environmental projects (launched June 2021) | Enables direct passenger contribution to emissions mitigation |
| Digitalisation | Electronic Flight Bags (EFB) | Introduced in 2019 to replace paper manuals for flight crew | Reduced paper usage and aircraft weight |
| Digitalisation | Cabin crew manuals on tablets | Safety manuals digitised in 2021 for cabin crew | Cuts paper consumption; improves operational efficiency |
| Passenger Experience | Removal of physical inflight magazines | Replaced with ScootHub digital portal for content, games, and flight tracking | Eliminates paper waste onboard flights |
| Operational Efficiency | Faster crew-ground communication | Digital systems enable quicker data sharing between crew and ground staff | Reduces inefficiencies → indirectly lowers fuel and resource use |
| Group-Level Strategy | Alignment with IATA Four-Pillar Strategy | Scoot supports industry framework covering technology, operations, infrastructure, and economic measures | Structured, long-term emissions reduction approach |
Additionally, waste reduction initiatives under the “5Rs” framework (Refuse, Reduce, Reuse, Recycle, Repurpose) highlight how even low-cost airlines are embedding sustainability into day-to-day operations.
Similarly, Wizz Air and Frontier Airlines rely heavily on young, fuel-efficient fleets. Jeremy Bowen, CEO of Cirium, also opined that fleet modernization is an efficient method for aviation sustainability:
Airline emissions performance comes down to decisions airlines can control — fleet choices, seat configuration and how aircraft are deployed on routes,” said . “The airlines at the top of these rankings have got those fundamentals right, and it shows. Better emissions efficiency and lower fuel bills go hand in hand.
Wizz Air operates more than five times the number of flights (335,000) and emits over three times as much CO₂, yet still maintains a competitive emissions intensity of 52.9 g/ASK, largely due to its younger fleet (4.7 years vs Scoot’s 6.7). Meanwhile, airlines like TUI Airways and Air Europa achieve similar efficiency levels despite operating longer average routes.
Further down the table, a clear divide emerges between short-haul, high-frequency operators and long-haul or hybrid carriers. Virgin Atlantic, for instance, records a relatively strong 54.5 g/ASK despite flying far longer average sectors (6,566 km), compared to low-cost carriers like Pegasus Airlines and IndiGo, which operate shorter routes but higher flight volumes. IndiGo, in particular, stands out with 796,000 annual flights—the highest in the dataset—yet a higher emissions intensity (57.36 g/ASK), indicating the limits of short-haul efficiency.
Comparative Analysis of Top 15 Airlines by Emissions Efficiency (Reverse Order)
| Rank | Airline | CO₂ / ASK (g) | Flights (000s) | Fleet Age (yrs) | Avg Distance (km) |
|---|---|---|---|---|---|
| 15 | IndiGo | 57.36 | 796 | 4.2 | 1,082 |
| 14 | Volaris | 57.33 | 180 | 7.5 | 1,532 |
| 13 | Iberia | 57.03 | 100 | 11.5 | 2,831 |
| 12 | Spirit Airlines | 56.77 | 217 | 6.4 | 1,535 |
| 11 | Condor | 56.15 | 55 | 11.2 | 2,883 |
| 10 | Jetstar Airways | 56.0 | 183 | 11.1 | 1,623 |
| 9 | Pegasus Airlines | 55.9 | 233 | 5.0 | 1,372 |
| 8 | AirAsia X | 54.8 | 20 | 14.0 | 4,177 |
| 7 | Virgin Atlantic | 54.5 | 27 | 6.8 | 6,566 |
| 6 | TUIfly | 54.4 | 58 | 10.6 | 2,475 |
| 5 | Frontier Airlines | 54.1 | 208 | 4.8 | 1,470 |
| 4 | Air Europa | 53.9 | 69 | 10.0 | 2,023 |
| 3 | TUI Airways | 53.6 | 66 | 9.7 | 2,862 |
| 2 | Wizz Air | 52.9 | 335 | 4.7 | 1,547 |
| 1 | Scoot | 51.0 | 65 | 6.7 | 2,157 |
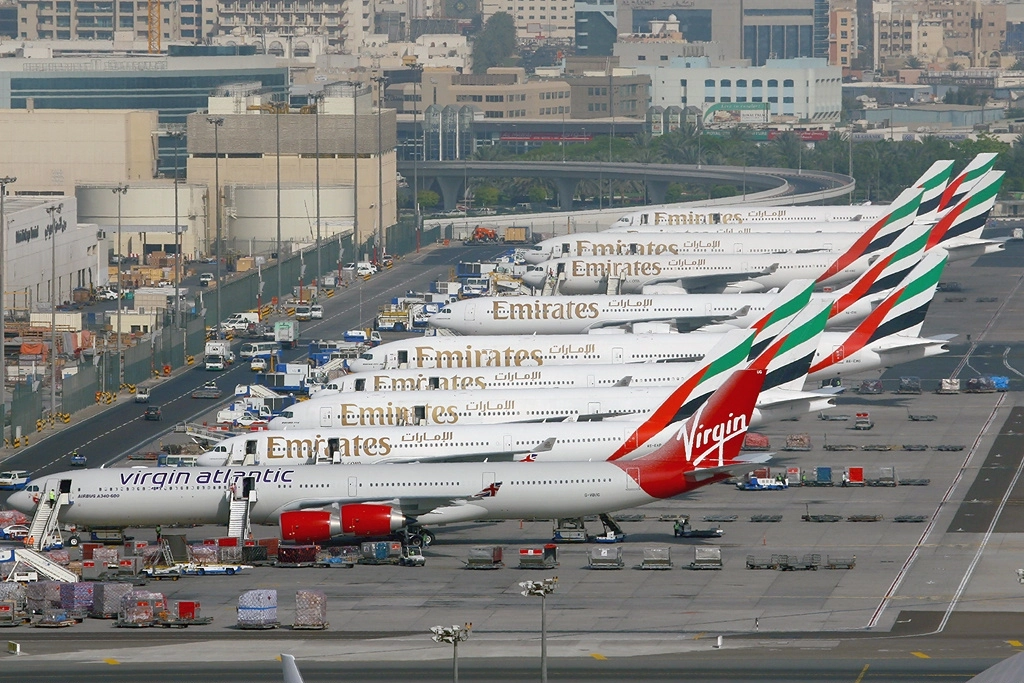
Middle East Carriers Are the Most Efficient by ASK
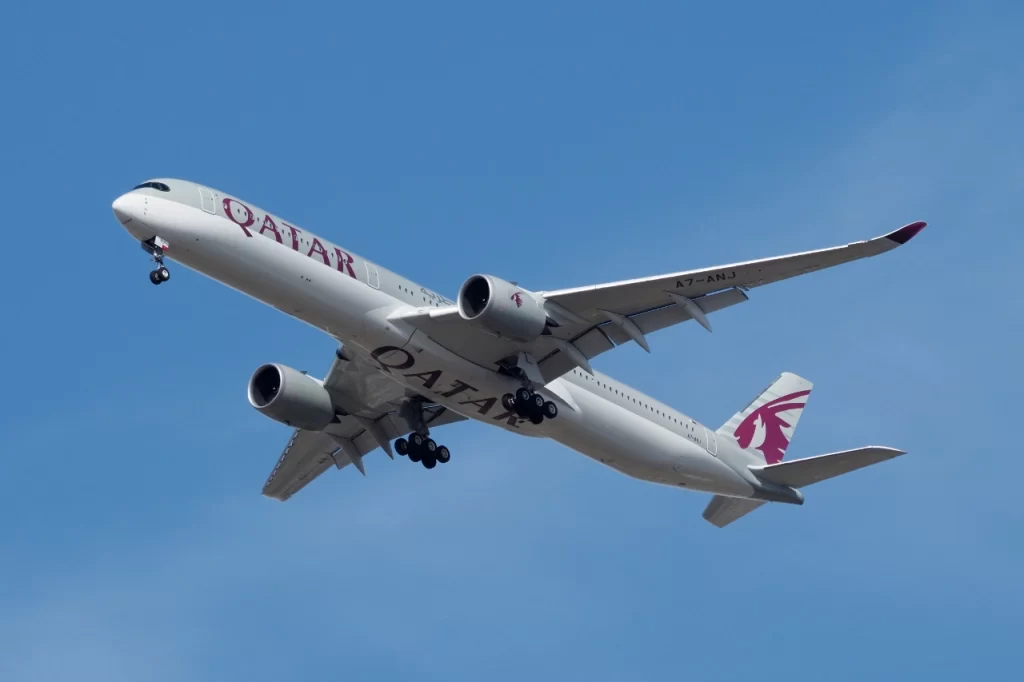
At the top of the three most efficient global airlines, ranked by available seat kilometres (ASK), is Qatar Airways which records 60.0 g of CO₂ per ASK. Despite operating a relatively large fleet and long average stage lengths of 4,221 km, its performance is shaped by a mid-aged fleet (10.2 years).
In contrast, Ryanair—while ranking second—operates on a completely different scale, flying over 1.1 million flights annually. Its slightly higher emissions intensity of 62.7 g/ASK reflects the inherent inefficiency of short-haul operations (1,264 km average), even though its fleet remains relatively modern and highly utilised.
Further down, Turkish Airlines demonstrates a hybrid efficiency profile, balancing both short- and long-haul networks with an average stage length of 2,332 km. While its CO₂ intensity of 64.2 g/ASK is higher than both Qatar Airways and Ryanair, it operates with a slightly younger fleet than Qatar Airways, yet still has higher emissions per seat-kilometers.
Regional Efficiency Leaders
Across regions, the data shows that emissions efficiency is less about geography and more about operating model, fleet age, and route structure.
Low-cost carriers consistently dominate short-haul markets: Frontier Airlines (54.5 g/ASK) in North America, Wizz Air (53.1 g/ASK) in Europe, and VietJet Air (64.5 g/ASK) in Southeast Asia all outperform legacy competitors in their regions due to younger fleets and high-density seating.
However, the comparison also shows that Europe’s efficiency leaders operate at materially lower emissions intensity than Southeast Asia, reflecting differences in average fleet age and network maturity, with Wizz Air’s 4.6-year fleet contrasting sharply with Lion Air’s 13.3-year average.
A clearer divergence appears when comparing long-haul operators across regions. On ultra-long sectors, Virgin Atlantic leads transatlantic efficiency at 53.7 g/ASK despite operating one of the longest average stage lengths (6,759 km), while transpacific operations show higher baseline emissions, with Cathay Pacific reaching 59.8 g/ASK over routes exceeding 11,900 km.
Notably, even efficient long-haul performers like Air Canada show contrasting outcomes across categories—ranking relatively well in transpacific operations (56.2 g/ASK) but appearing less competitive in transatlantic efficiency comparisons.
| Region | Rank | Airline | CO₂ / ASK (g) | Flights (000s) | Fleet Age (yrs) | Avg Distance (km) |
|---|---|---|---|---|---|---|
| North America | 1 | Frontier Airlines | 54.5 | 185 | 4.8 | 1,402 |
| North America | 2 | Spirit Airlines | 57.4 | 185 | 6.5 | 1,463 |
| North America | 3 | WestJet | 67.0 | 175 | 11.5 | 1,348 |
| Europe | 1 | Wizz Air | 53.1 | 222 | 4.6 | 1,462 |
| Europe | 2 | Jet2 | 57.9 | 110 | 13.6 | 2,206 |
| Europe | 3 | Transavia | 59.9 | 116 | 10.5 | 1,491 |
| Southeast Asia | 1 | VietJet Air | 64.5 | 107 | 8.2 | 941 |
| Southeast Asia | 2 | Singapore Airlines | 66.7 | 45 | 5.9 | 1,181 |
| Southeast Asia | 3 | Lion Air | 67.1 | 90 | 13.3 | 828 |
| Latin America | 1 | JetSmart | 57.9 | 92 | 3.1 | 1,033 |
| Latin America | 2 | Volaris | 58.8 | 137 | 7.6 | 1,297 |
| Latin America | 3 | VivaAerobus | 61.4 | 157 | 9.1 | 1,069 |
| Transatlantic | 1 | Virgin Atlantic | 53.7 | 16.9 | 6.5 | 6,759 |
| Transatlantic | 2 | Air Canada | 54.9 | 24.4 | 14.4 | 6,108 |
| Transatlantic | 3 | Aer Lingus | 56.2 | 15.1 | 9.0 | 5,793 |
| Transpacific | 1 | Air Canada | 56.2 | 8.9 | 10.2 | 10,178 |
| Transpacific | 2 | Delta Air Lines | 57.5 | 11.3 | 6.1 | 9,945 |
| Transpacific | 3 | Cathay Pacific | 59.8 | 10.8 | 9.0 | 11,933 |
Data: Business Wire